I’ve been working on some numbers and came to some tentative conclusions about human attractiveness. If we’re being realistic then we start from the premise that attractiveness follows normal distribution. If we’re being realistic.
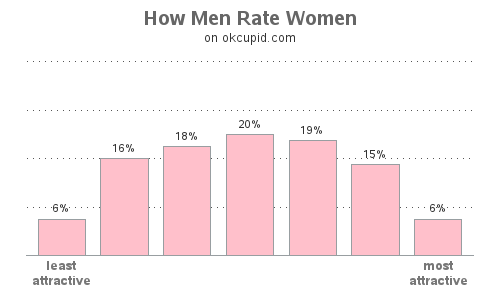
Online surveys show that men are realistic in rating attractiveness:
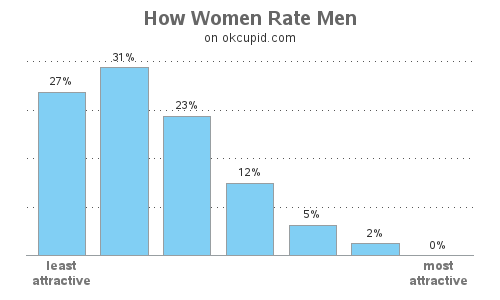
Women are off in La La Land:
I’m going with the realistic men’s perspective, since it follows normal distribution, but this should work the other way too if we’re assuming women pre-Internet had realistic expectations of men since they were limited to the men who lived nearby. That’s why I was drawing boxes under the curve, because A. I don’t know what the equation is, and 2. If I did I don’t know calculus to make sense of it anyway. So I took a normal distribution curve someone else drew and drew boxes under it to estimate.
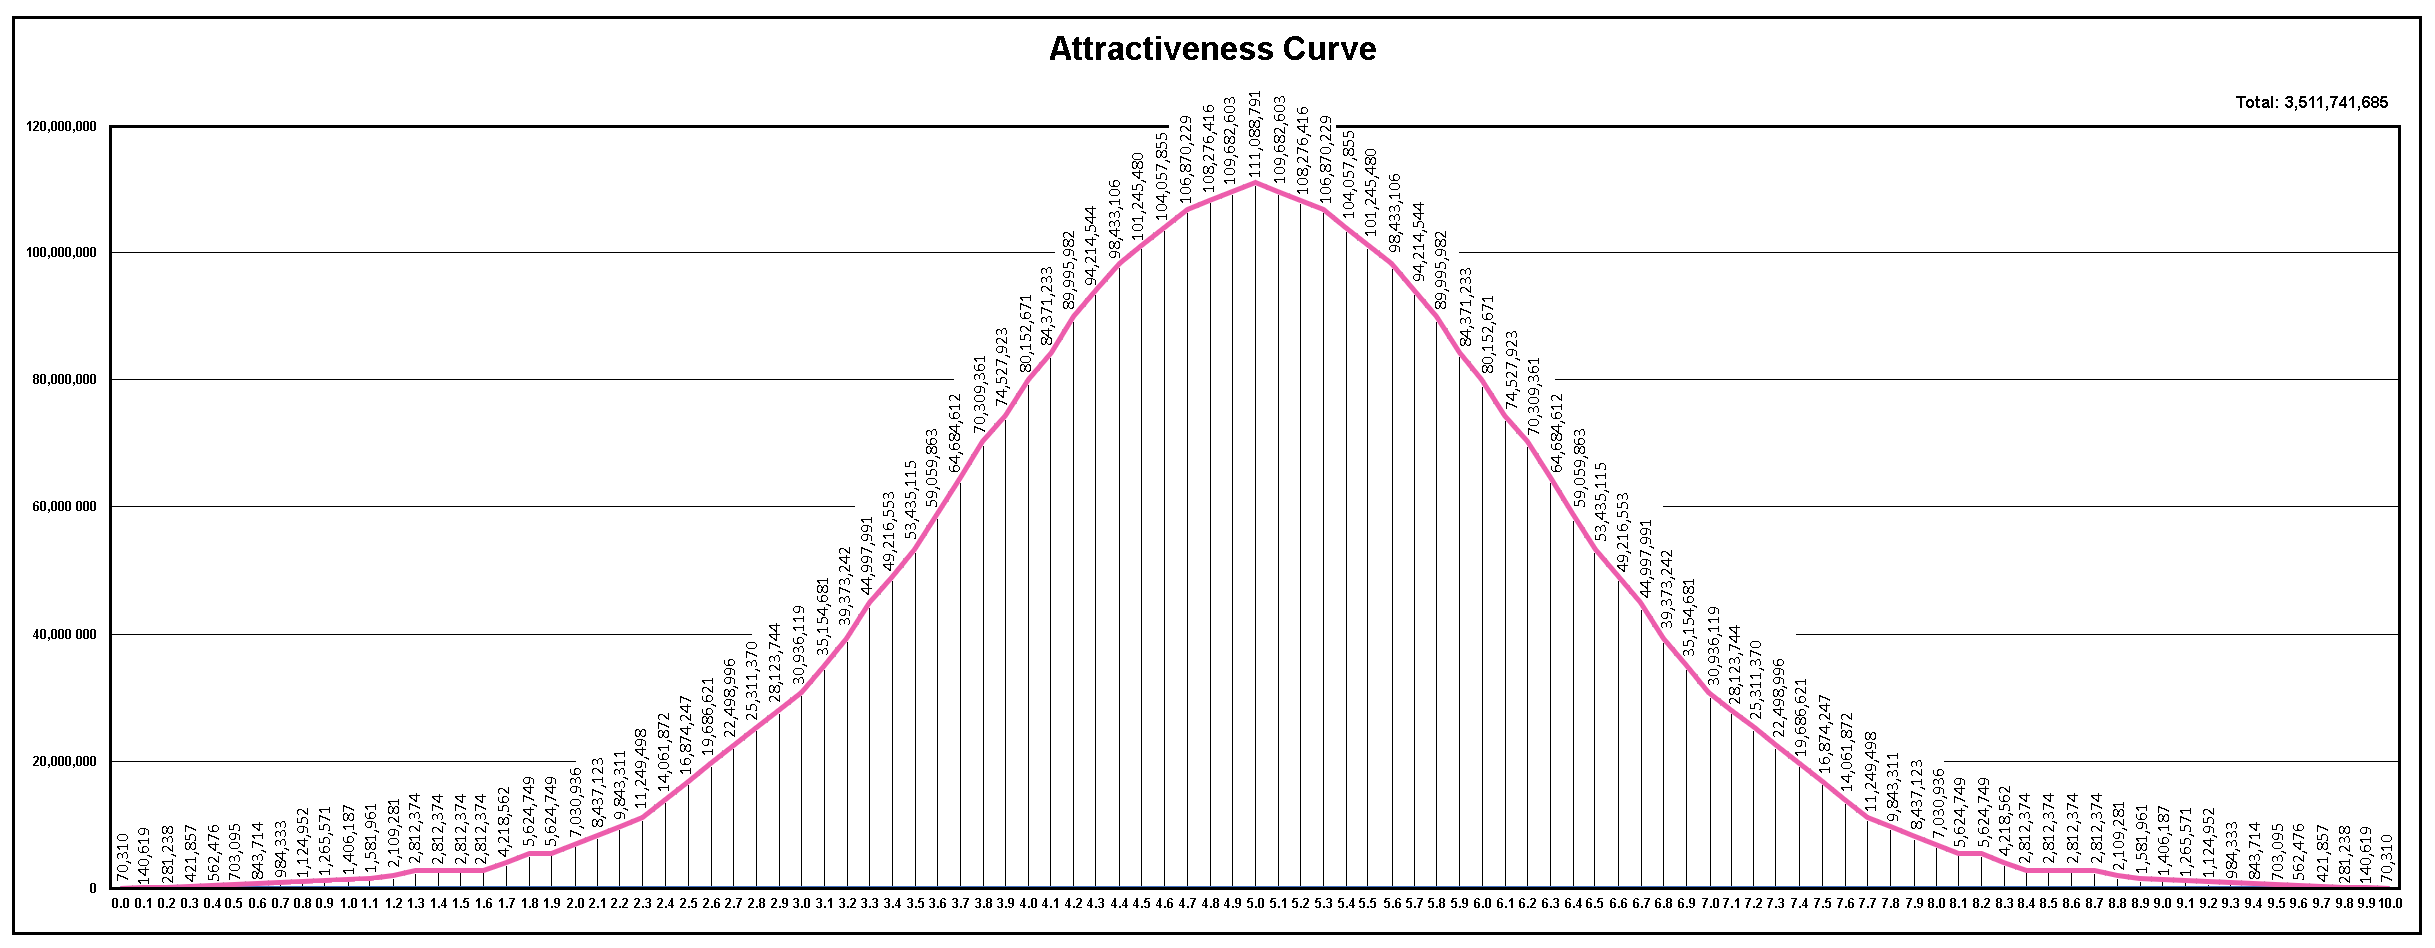
It’s fairly accurate out to 3 standard deviations (on my chart that’s between 1.0 and 9.0).
I’m rounding the total population to 8 billion, 1 billion of whom are children. There are roughly equal number of men and women, so 3.5 billion each.
Now I created that chart on the assumption that the 0-10 scale is evenly distributed across the curve. IF that’s true then 50% of everyone falls between 4.1 and 5.8.
If my scale is true then only 0.1% of people are 9.0 and above (about 3.5 million men and 3.5 million women). Anything above that is just me guessing, with about 70,000 at 10.0 (about 4 sigma; with 6 sigma being a hypothetical 12.6/10, which should be technically possible given the size of the population, with about 7 men and 7 women at that level).
Looking at this it seems wrong. Either people are using a different scale, and the numbers aren’t evenly distributed, or higher and lower numbers are being over/under reported (too many people (too many women) are being given scores 8+ for instance (also, too many men are being given scores below 3). The curve might be flatter, with longer tails, I don’t know.
What do you think? How often do you think someone realistically encounters a 8+? Have you?